Sell-through rate is the share of a buy that sold during a set period, figured as units sold divided by units received during that period, times 100. If you received 120 bags of grass seed in March and had sold 84 of them by May 31, your sell-through rate on that buy is 70%.
That is the whole formula, and the rest of this guide is about when that number is worth your attention and when the number you want is inventory turns instead. If you came here from a retail blog that treats sell-through as the one metric that matters, you are in the right place, because you run a different kind of store and the translation is straightforward once you see what each number is built to answer.
The formula, worked with store numbers
Here is the formula in full:
Sell-through rate = units sold during a period / units received during that period x 100
If you started the period with stock already on the shelf and then received more, the denominator is beginning on hand plus units received. You can run the same math in dollars at cost when that is easier to pull, and it lands on the same answer as long as your cost stayed put over the period.
Here it is with numbers from the feed aisle. Say a pallet of layer feed shows up in April, 60 bags at a cost of $16.50 each. By the end of June you have sold 45 bags.
| Layer feed buy | Units | Dollars at cost |
|---|---|---|
| Received in April | 60 | $990.00 |
| Sold by June 30 | 45 | $742.50 |
| Sell-through rate | 75% | 75% |
Forty-five divided by sixty is 0.75, and $742.50 divided by $990.00 is the same 0.75, so you get 75% either way you count it. That is a decent result for a two-month window on a buy with no hard end date, and it tells you the pallet was sized about right.
Why the supply-store trade talks turns instead
Sell-through rate comes from apparel and seasonal retail, where the question is whether a buy with a season and an end date sold before markdown time. A fashion buyer needs to know if the spring line moved by June, because what is left in July gets marked down or packed out.
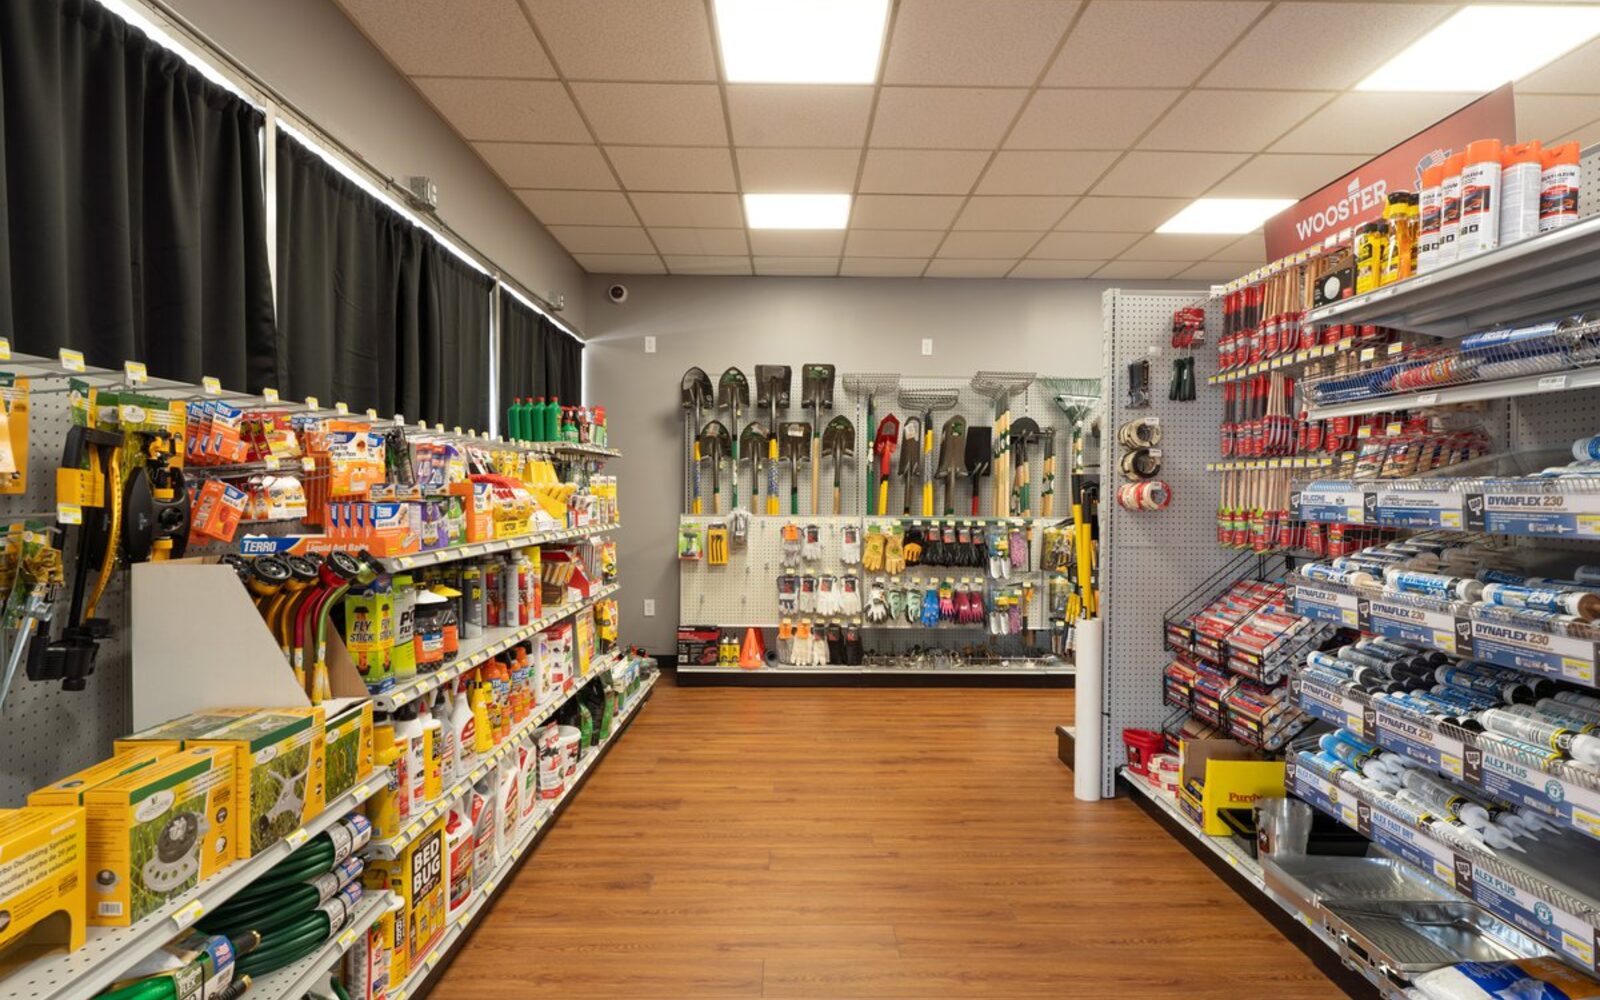
Most of your store does not work like that. The $12.40 box of deck screws on your shelf is not a spring line, since you have sold that box, or one a lot like it, for years, and when the shelf gets low you put it on the next purchase order to your vendor and more show up on truck day. Asking what share of one screw delivery sold through is a bit like asking what share of a river flowed past your dock today. The river keeps coming, and so does the truck.
So the trade watches inventory turns instead, which is cost of goods sold divided by average inventory at cost. Turns tell you how fast the whole replenished stock of the store is cycling, staples and all, which is the question that matters when most of your dollars sit in items you reorder forever. We have a full walkthrough of that math in the guide to inventory turnover ratio and GMROI for hardware stores.
How sell-through and turns translate to each other
The two numbers are cousins rather than twins. Sell-through measures the progress of one bucket: this receipt, this seasonal program, this buy, from the day it landed to today. Turns measure a rate across the year: how many times you sold through your average stock position.
For a single item over a full year, the link is close enough to do on a napkin. Say you keep an average of 10 boxes of deck screws on the shelf and you sell 60 boxes over the year. That is 6 turns, and it means any particular delivery of 10 boxes sells through in about two months, since 365 days divided by 6 turns is roughly 61 days. High turns and fast sell-through are the same healthy thing, described from two different angles.
Where operators get tripped up is trying to convert one into the other inside a single period. If your grass seed sell-through is 70% at the end of May, you cannot divide anything by anything to get its annual turns, because the seed has a season and the screws do not, and average inventory for a seasonal item is a moving target from the day the buy lands to the day the last bag leaves. The plain answer is that the two numbers answer different questions: sell-through asks how this buy is doing, and turns ask how this item, department, or store performs across the year. Keep both questions around and pick the number that matches the one you are asking.
Where sell-through earns its keep in a supply store
Even in a store built on replenished staples, some of your buys have a season and an end date, and those are where sell-through belongs. The list is longer than most owners first think:
- Spring lawn and garden programs, from seed and fertilizer to bedding plants
- Grills, patio goods, and holiday items
- Ice melt and snow shovels, where the season can end overnight
- Early-order and booking programs, where you commit months ahead and want to know if the commitment was sized right
- New product tests, where you need a verdict before you add the item to the regular mix
- Special buys and closeouts, where there is no reorder coming and the only question is how fast the pile shrinks
- Garden center plant buys, which are perishable and will not wait politely in the back room the way a pallet of paint will
The way to run these is to set a target by a date before the buy even lands. Say you bring in 24 grills in April and decide you want 60% of them gone by Memorial Day, because whatever is left after that starts costing you floor space and, eventually, margin in markdowns. Then you track the number weekly, like this:
| Week | Grills sold (cumulative) | Sell-through rate |
|---|---|---|
| Week 1 | 3 | 12.5% |
| Week 2 | 7 | 29.2% |
| Week 3 | 12 | 50.0% |
| Week 4 | 15 | 62.5% |
At 62.5% after four weeks, you are on pace and you leave the price alone. If week 3 had shown 25%, that is the week you start thinking about a promotion, a better endcap, or a markdown, while the season still has time to work for you. If week 3 had shown 90%, you have a different problem, and the next section covers it. The same weekly habit works for bedding plants in a greenhouse, where the calendar is even less forgiving; the spring rush piece on greenhouse retail POS and spring rush checkout gets into the pace of those weeks.
The number is a decision tool rather than a report card. It tells you when to mark down, when to reorder, and when to return what your vendor will take back, early enough that the decision still matters.
Reading the number without fooling yourself
Two traps catch people who are new to sell-through, and both come from treating it as a score where higher is always better.
The first trap is the perfect score. If your grills hit 100% sell-through in week 2, put the trophy away, because that is a stockout signal: you under-bought, the shelf sat empty for the heart of the season, and every customer who walked in wanting a grill in week 3 and week 4 bought one somewhere else. High sell-through with weeks of season left means lost sales you never got to count. When that happens, the lesson for next year's buy is a bigger number, not a celebration.
The second trap is the panic. Low sell-through with plenty of season left is no reason to panic, since grass seed at 35% in mid-April might be right on pace if your seed business peaks in May. Before you mark anything down, check the calendar and check last year's curve if you have it. The number only means something against the date and against the target you set.
Which number answers which question
Once you stop asking one metric to do every job, the toolkit sorts itself out. Here is how the pairing works across a store like yours:
| The question you are asking | The number to use |
|---|---|
| Is this seasonal buy or one-time buy going to clear before the season ends? | Sell-through rate, tracked weekly against a target date |
| Is this replenished staple earning its shelf space across the year? | Inventory turns and GMROI |
| When do I reorder this item, and how much? | Days of supply, item by item |
| What is sitting in the back room doing nothing? | A dead stock review |
If you want to go deeper on any of those, we have guides for each: the inventory turnover and GMROI guide for staples, days inventory outstanding for the reorder question, finding and clearing dead stock for the back room, and an open-to-buy plan for supply stores for sizing next season's commitments before the booking programs close. Sell-through fits inside that open-to-buy work too, since this year's weekly curve is the best evidence you have when you set next year's quantities.
The stores that get this right ask the question that matches the buy in front of them, which is whether this pallet has a season and an end date or gets reordered forever. For a seasonal buy you watch sell-through, for a forever item you watch turns, and either way you keep the records so next year's buy is smarter than this year's.
How Rundoo handles it
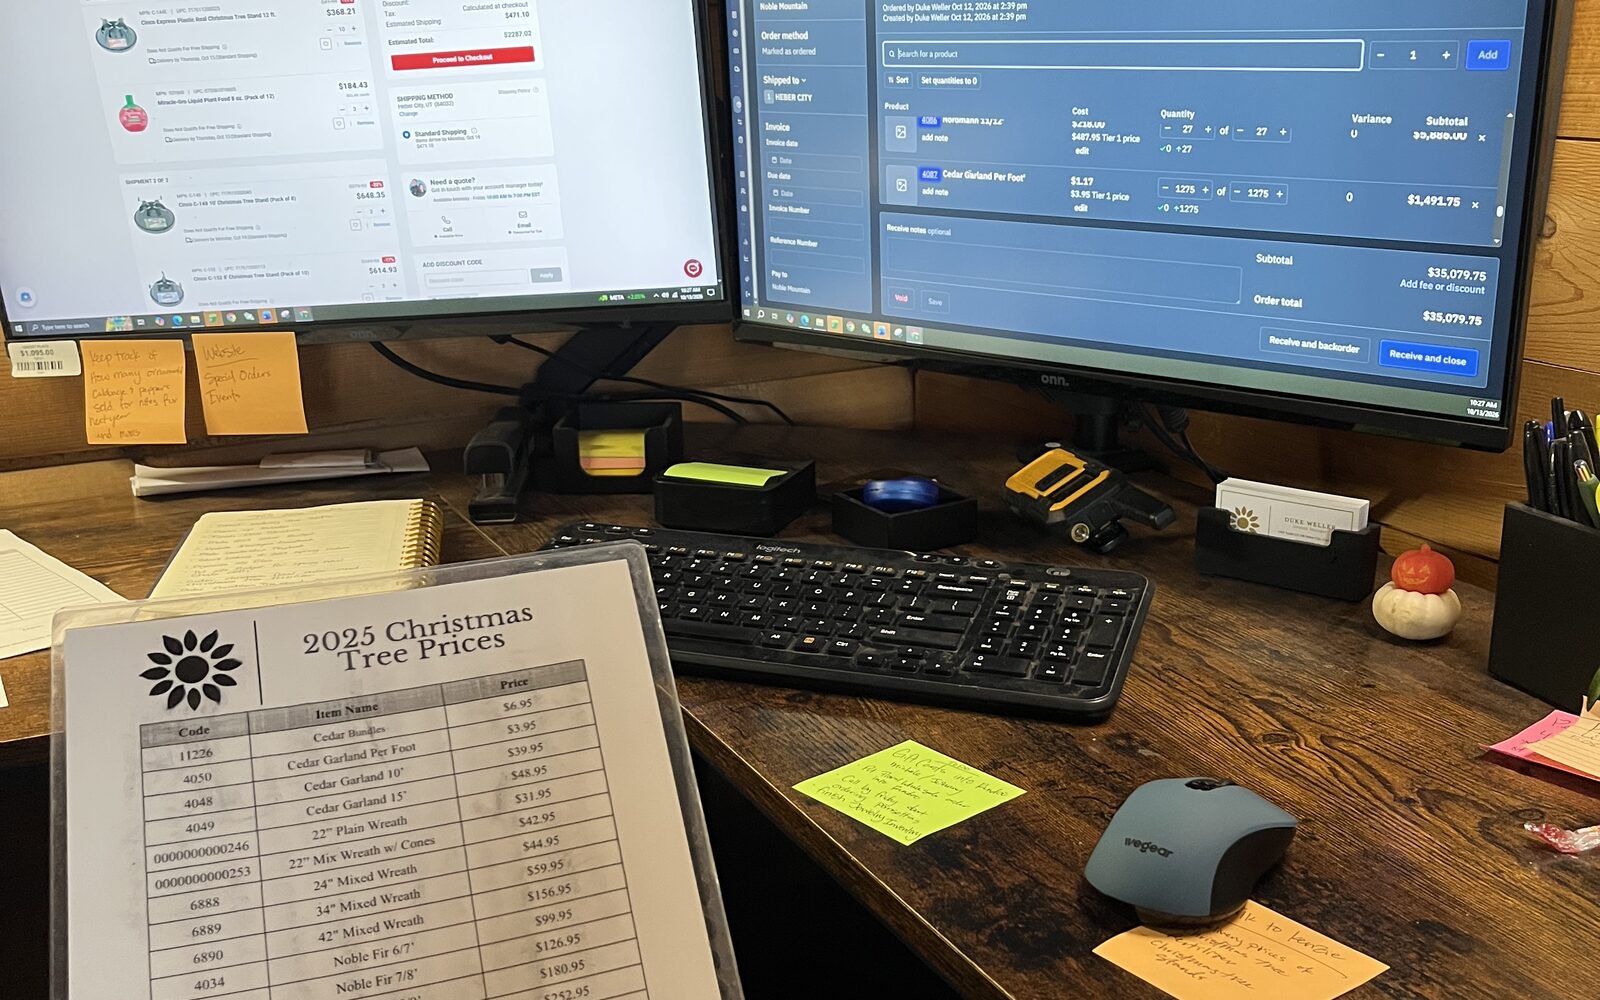
Rundoo shows units sold, margin, and stock turns on each product's detail page, above its transaction history, so the turns side of this guide is visible without pulling a report. For the sell-through side, the Inventory dataset in custom reports carries on hand, annual units sold, annual turns, and last sale date per product, and you can group it by location, department, or vendor, save it, rerun it each week of the season, and download it as a CSV to build the grill table from this guide with your own receipts. You can also ask Dooey, Rundoo's AI, for days of inventory on hand alongside revenue and quantity sold, which covers the reorder question from the table above without building anything.