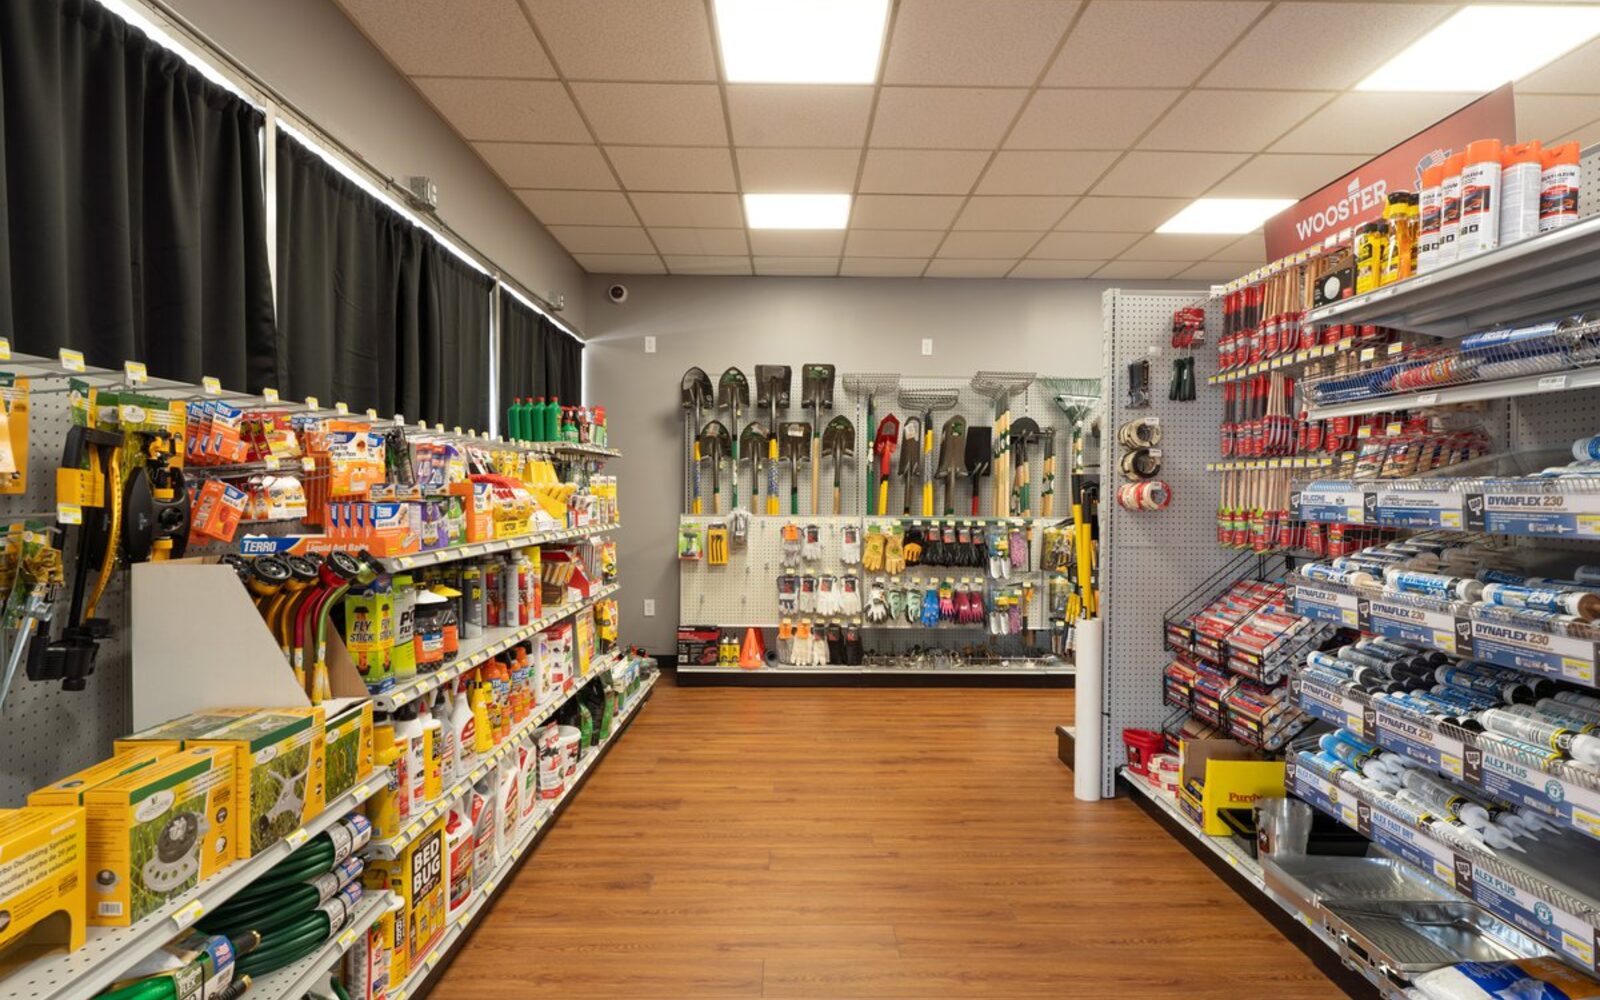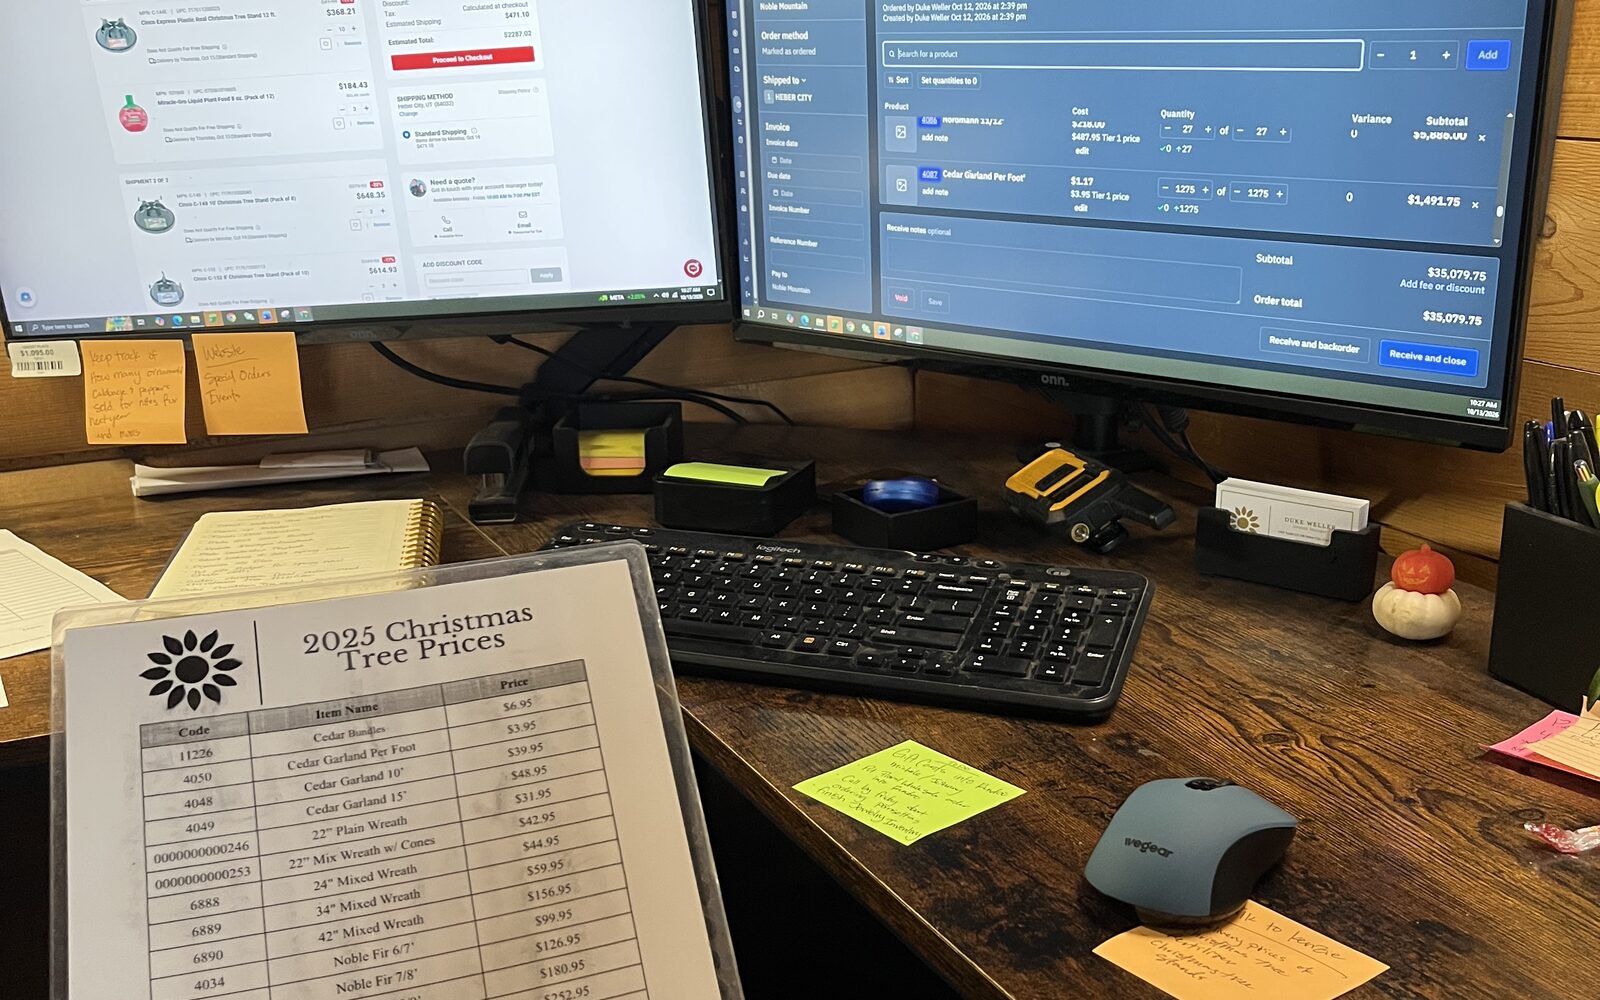
Days inventory outstanding (DIO) is the average number of days your stock sits on the shelf before it sells, calculated as (average inventory at cost / cost of goods sold for the period) x number of days in the period. For a full year, that is (average inventory at cost / annual COGS) x 365, which works out to the same thing as 365 divided by your inventory turns. You will also see it called days inventory on hand, days in inventory, or days sales of inventory (DSI), and they all mean the same number. Lower is better in most cases, because a lower DIO means the cash you spent at the receiving door comes back through the register faster.
Say your store did $1,800,000 in cost of goods sold last year and your average inventory at cost was $660,000. That gives you $660,000 / $1,800,000 x 365 = 133.8 days, which matches the 2.73 inventory turns from our inventory turnover and GMROI guide. Same store and same numbers, said two ways: your average dollar of inventory takes about 134 days to turn back into a sale.
Some owners find turns easier to compare year over year and DIO easier to feel. "2.73 turns" is abstract, while "that box of $12.40 deck screws sits there for four and a half months before somebody buys it" is a Friday afternoon at the counter.
DIO is one leg of your cash conversion cycle
DIO on its own tells you how long stock sits. The more useful question is how long your cash is gone between paying a vendor and getting paid by a customer, and for that you need the full cash conversion cycle:
Cash conversion cycle = DIO + days sales outstanding minus days payables outstanding
Days sales outstanding is how long your charge accounts take to pay you after the sale, and days payables outstanding is how long you take to pay your vendors. Run it with realistic store numbers: you pay the distributor in 30 days, you carry 134 days of stock, and your contractor charge accounts settle up in about 45 days. That is 134 + 45 minus 30, or 149 days of cash tied up in the business at any given moment.
That number reframes a lot of decisions. A store can have healthy margins and still feel broke every truck day, because the cash is parked on shelves and sitting in receivables. If you want to work the receivables leg, our guide to house accounts, statements, aging, and finance charges covers the days sales outstanding side. And if you want to put a dollar figure on what those 134 days cost you in storage, insurance, and tied-up credit, the inventory carrying cost guide walks through it.
Why a single snapshot misleads you
Your accountant gives you DIO off the year-end balance sheet, and that number can be quietly wrong for a seasonal store. A farm and feed store counted on December 31 looks lean, because the inventory is at its annual low, while the same store counted on April 30, loaded up with feed, seed, and chick supplies, looks bloated, and neither snapshot tells you the truth. Average your inventory from monthly snapshots, or at minimum from beginning and ending balances across the full year, before you draw any conclusions.
Department mix matters too. Fasteners are the classic case: a deep wall of bins carries a long DIO, but the margin on a box of screws is fat and the cost of being out is a contractor who starts buying them somewhere else. Power tools tend to run the opposite, with shorter DIO and thinner margins. Comparing your fasteners DIO to your power tools DIO tells you nothing; comparing each department to its own history tells you a lot.
Weeks of supply: the item-level version
DIO is a backward-looking, store-level number built on dollars. Weeks of supply is its forward-looking cousin, built on units, and it answers the question you ask on a Tuesday morning: how long will what I have last?
Weeks of supply = units on hand / average weekly units sold
You have 140 bags of layer feed on hand at $16.50 a bag, and you sell about 46 bags a week. That is 140 / 46 = roughly 3 weeks of supply. Now the judgment call: with a weekly truck and a one-week lead time from your vendor, 3 weeks is comfortable, maybe even a touch heavy. But if you run the same math on a slow-moving specialty item and find 12 weeks of supply, you are looking at cash parked on a shelf, earning nothing while the carrying cost meter runs, rather than a safety cushion.
Weeks of supply also handles seasonality better than DIO does, because you can swap in a forecast. If May feed sales run double March sales, your average weekly sales number from last month understates what is coming, so you use the forecast weekly number instead and order into the curve.
Stock-to-sales ratio: the buyer's planning tool
Stock-to-sales ratio is the third member of this family, and it exists to drive buying plans rather than to grade past performance:
Stock-to-sales ratio = inventory value at the beginning of the month / sales for that month
Traditionally both figures are at retail in retail planning. Whatever basis you pick, keep both sides of the division on the same basis, cost with cost or retail with retail, or the ratio lies to you.
Say April starts with $90,000 of lawn and garden inventory at retail, and April lawn and garden sales come in at $45,000. Your stock-to-sales ratio for April is 2.0: two dollars of stock for every dollar of sales. Multiply that out and it becomes a buying plan. If you plan $50,000 in May lawn and garden sales and want to hold that same 2.0 ratio, your beginning-of-May stock target is $100,000 at retail. Beginning-of-month stock equals planned sales times planned stock-to-sales ratio, and that little multiplication is the engine under open-to-buy. The open-to-buy plan guide for supply stores takes it from there into a full monthly buying budget.
How the three fit together
Each measure answers a different question, and mixing them up is where owners get crossed wires:
| Measure | Unit | Question it answers | Looks |
|---|---|---|---|
| Days inventory outstanding | Days (dollars) | How long does my average dollar of stock sit? | Backward, store or department level |
| Weeks of supply | Weeks (units) | How long will this item last? | Forward, item level |
| Stock-to-sales ratio | Ratio (dollars) | How much stock do I need to support planned sales? | Forward, department or category level |
In practice they form a loop. DIO tells you whether the store as a whole is carrying too much. Weeks of supply tells you which specific items are the culprits, because a bloated store-level DIO is always a few hundred bloated SKUs wearing a trench coat. Stock-to-sales ratio then sets the buying targets that keep next season from repeating the problem. If you also want the turns-based view of the same picture, and how it differs from the retail metric it often gets confused with, see how sell-through rate translates to inventory turns.
How to lower DIO without running out of stock
Every owner wants the cash back, and nobody wants an empty hook when a contractor walks in. The levers that work:
- Cut dead stock first. Anything with no sales in twelve months is closer to a museum exhibit with a cost basis than to inventory. Clear it at a discount, donate it, or return it to the vendor if your program allows, and put the dollars into something that moves.
- Order A items smaller and more often. Your fastest movers can ride a shorter cycle. If the vendor truck comes weekly, holding six weeks of a fast mover is a habit, not a need.
- Tune min and max levels to velocity. A min and max set three years ago reflects a store that no longer exists, so recheck your fastest and slowest items a couple of times a year.
- Send slow goods back to the vendor. If your vendor offers a stock-adjustment or return program, a return that costs you a restocking fee usually beats another twelve months of carrying cost.
- Stop forward-buying without a reason. A vendor deal is only a deal if the discount beats the carrying cost of the extra months of stock. Run the math before the truck shows up, because after it shows up the math gets sentimental.
How Rundoo handles it
Each product's detail page in Rundoo shows units sold, margin, and stock turns right above its transaction history, so the velocity check happens where you are already looking. The Inventory dataset in custom reports carries on hand, on-hand value, annual turns, last sale date, and annual units sold, and you can group it by location, department, or vendor, save it, rerun it, and download it as a CSV when your accountant asks. For valuation, Rundoo exposes three figures, on-hand value (average cost times on hand), stock value (which includes committed units), and ledger valuation, with landed cost from received purchase orders flowing into average cost and then into cost of goods sold as items sell. On the buying side, Min and Max are set per product per location, and when on hand plus on order drops to or below Min, Rundoo suggests enough to reach Max, rounded up to case quantity; the purchase order builder's Generate order offers Replenishment, Min & Max, and Predictive, a year-over-year forecast. And if you want the number in plain English, Dooey answers questions across locations and can return days of inventory on hand alongside revenue and quantity sold.